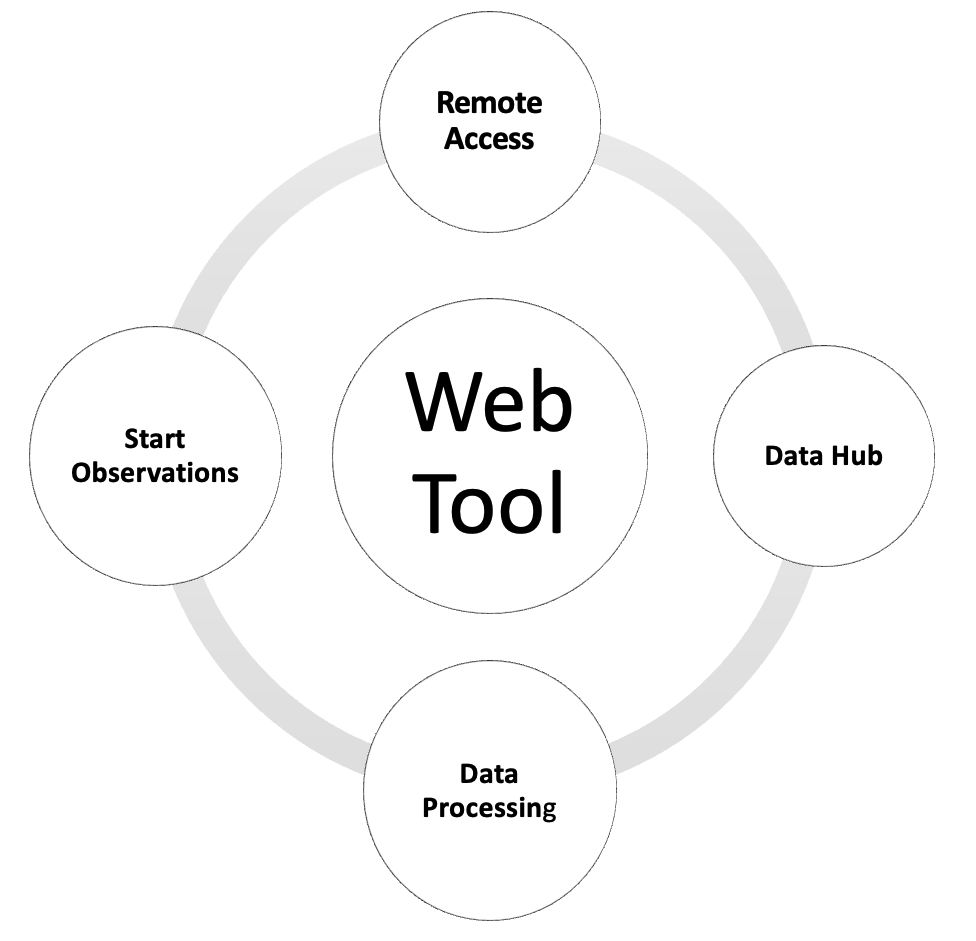
With the evolution of radio astronomy, related education and training, the demand for scalable, efficient, and remote systems in data acquisition, storage, and analysis has significantly increased. Addressing this need, we have developed a web interface for a log-periodic dipole antenna (LPDA) array integral to the SKA Test activities at the Gauribidanur Radio Observatory (77.428 E, 13.603 N). This interface, employing Python-based technologies such as Streamlit and PyVISA, along with SCPI commands, offers a seamless and user-friendly experience. Our solution introduces a unique data acquisition approach, employing SCPI through Python to communicate with the setup's Data Acquisition System (DAS). The web interface, accessible remotely via a secure WLAN network or VPN, facilitates user-initiated observations and comprehensive logging and offers advanced features like manual RFI masking, transit plotting, and fringe plot analysis. Additionally, it acts as a data hub, allowing for the remote downloading of observational data. These capabilities significantly enhance the user's ability to conduct detailed post-observation data analysis. The effectiveness of this interface is further demonstrated through a successful solar transit observation, validating its utility and accuracy in real-world astronomical applications. The applications of this web tool are expandable and can be tailored according to the Observatory's Goals and Instrumentation as well as for the growing radio astronomy instrumentation and observing facilities coming up at various educational institutions.
astropi-b
Gauribidanur LPDA Array Observational Tool (GLOT)
A web-based platform for remote acquisition, monitoring, and visualization of LPDA arrays at the Gauribidanur Radio Observatory.
Demonstrations
Featured below are the demonstration videos of our web tool in action. The first video highlights the tool’s capability for conducting remote observations from the Raman Research Institute, located 90 km away from the Gauribidanur Radio Observatory. It also demonstrates the functionality to download collected data and perform minimal data processing. The second video showcases the updated version of the web tool, which now includes features for manual RFI masking and transit plotting, as exemplified through a solar transit observation.